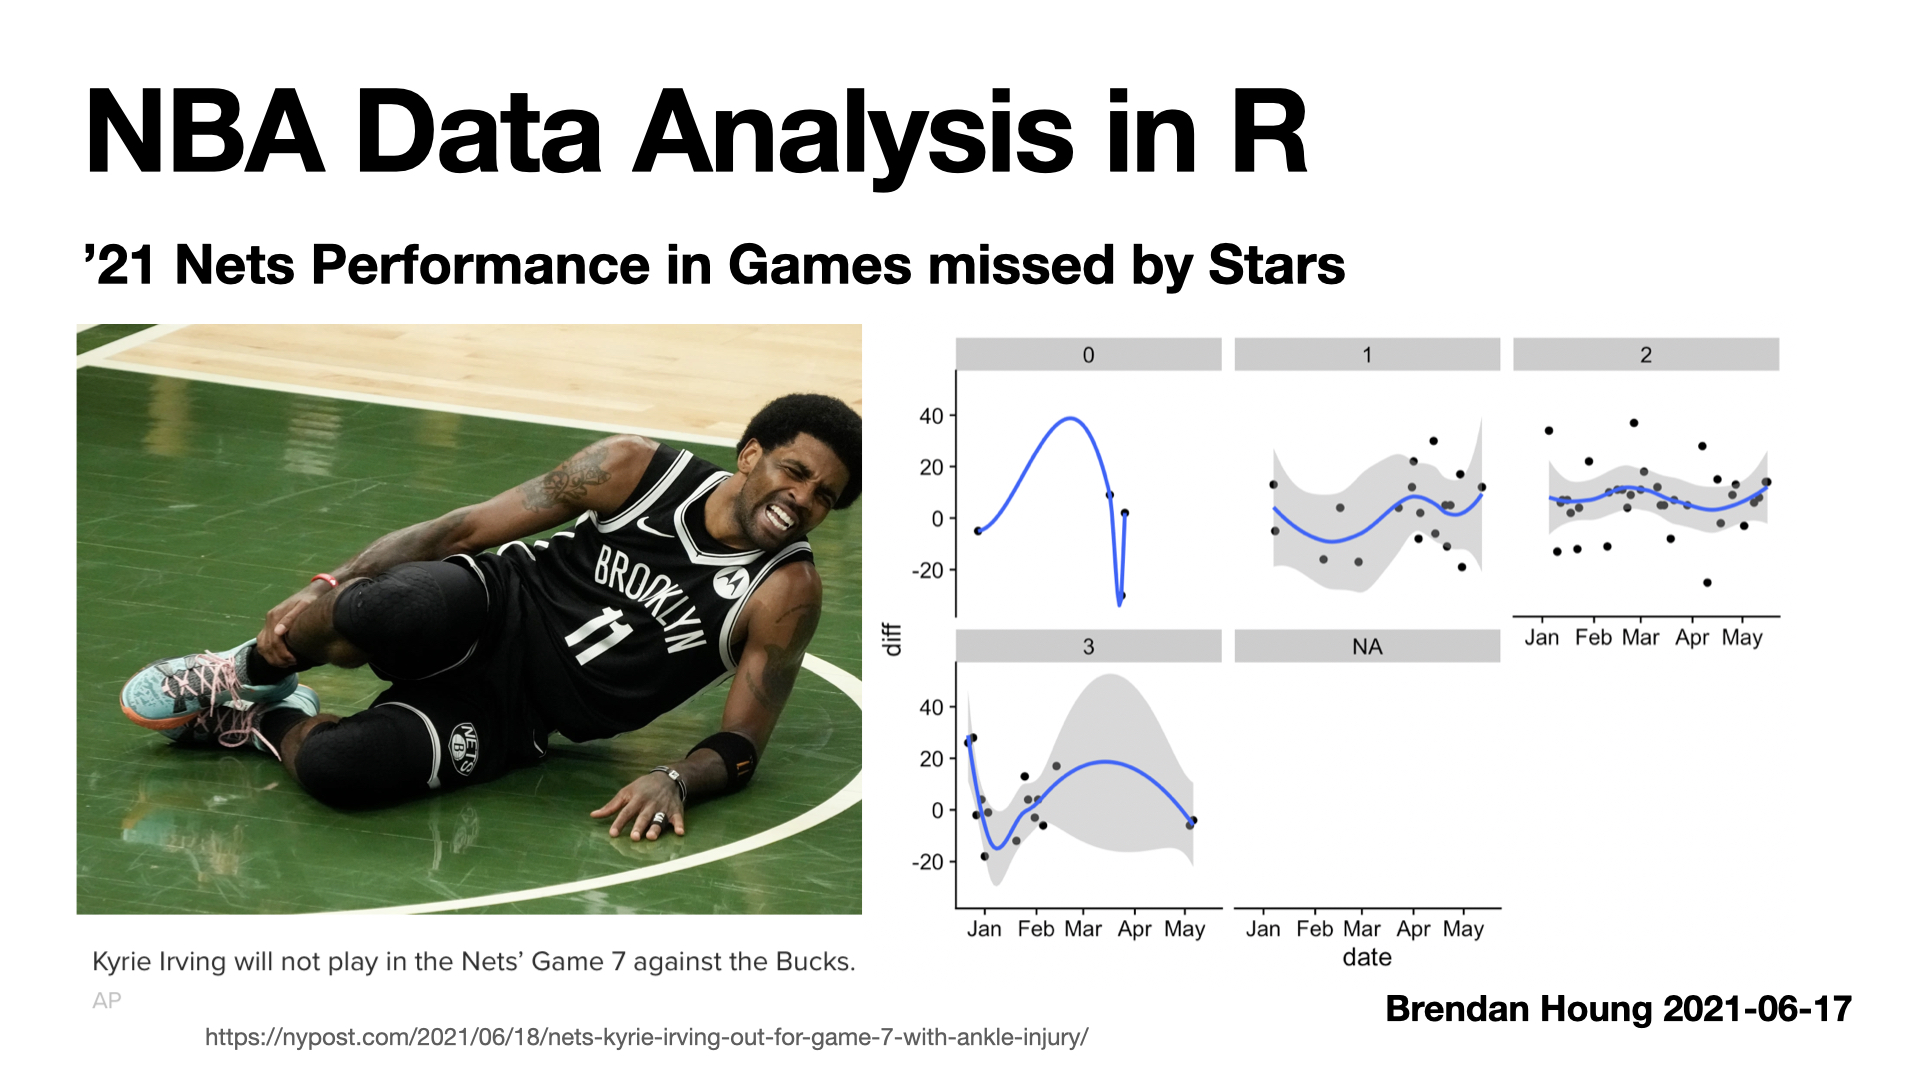
Nets performance in games missed by stars
In sceencast #2 I ask how the Nets performed in the regular NBA season depending on how many of their stars played.
code: https://gist.github.com/bhoung/769ea023915bc7f6802f667249b54508
link to YouTube screencast #2 here
R Markdown
library(rvest)
library(tidyverse)
irving <- "https://www.basketball-reference.com/players/i/irvinky01/gamelog/2021"
harden <- "https://www.basketball-reference.com/players/h/hardeja01/gamelog/2021"
durant <- "https://www.basketball-reference.com/players/d/duranke01/gamelog/2021"

get_data <- function(player_url) {
  html <- read_html(player_url)
  tables <- html %>% html_nodes("table") %>% html_table()
  df <- tables[8] %>% data.frame()
  return(df)
}
df1 <- get_data(irving)
df2 <- get_data(harden)
df3 <- get_data(durant)
nets_games_url <- 'https://www.basketball-reference.com/teams/BRK/2021_games.html'
html <- read_html(nets_games_url)
tables <- html %>% html_nodes("table") %>% html_table()

nets_regular_season <- tables[[1]] %>% data.frame()
nets_playoffs <- tables[[2]] %>% data.frame()

games <- nets_regular_season %>% select(G, Date, Var.6, Opponent, Var.8, Tm, Opp)
names(games) <- c("G", "Date", "Home", "Opponent", "WinLoss", "Team", "Opp")
games$date <- apply(games, 1, FUN = function(x) {substr(x[c("Date")], 6, 20) })
games$date <- as.Date(games$date, c("%B %d, %Y"))

glimpse(games)
## Rows: 75
## Columns: 8
## $ G        <chr> "1", "2", "3", "4", "5", "6", "7", "8", "9", "10", "11", "12"…
## $ Date     <chr> "Tue, Dec 22, 2020", "Fri, Dec 25, 2020", "Sun, Dec 27, 2020"…
## $ Home     <chr> "", "@", "@", "", "", "", "", "", "", "@", "", "", "@", "", "…
## $ Opponent <chr> "Golden State Warriors", "Boston Celtics", "Charlotte Hornets…
## $ WinLoss  <chr> "W", "W", "L", "L", "W", "L", "L", "W", "W", "L", "L", "W", "…
## $ Team     <chr> "125", "123", "104", "111", "145", "96", "122", "130", "122",…
## $ Opp      <chr> "99", "95", "106", "116", "141", "114", "123", "96", "109", "…
## $ date     <date> 2020-12-22, 2020-12-25, 2020-12-27, 2020-12-28, 2020-12-30, …
games$Team <- as.integer(games$Team)
games$Opp <- as.integer(games$Opp)
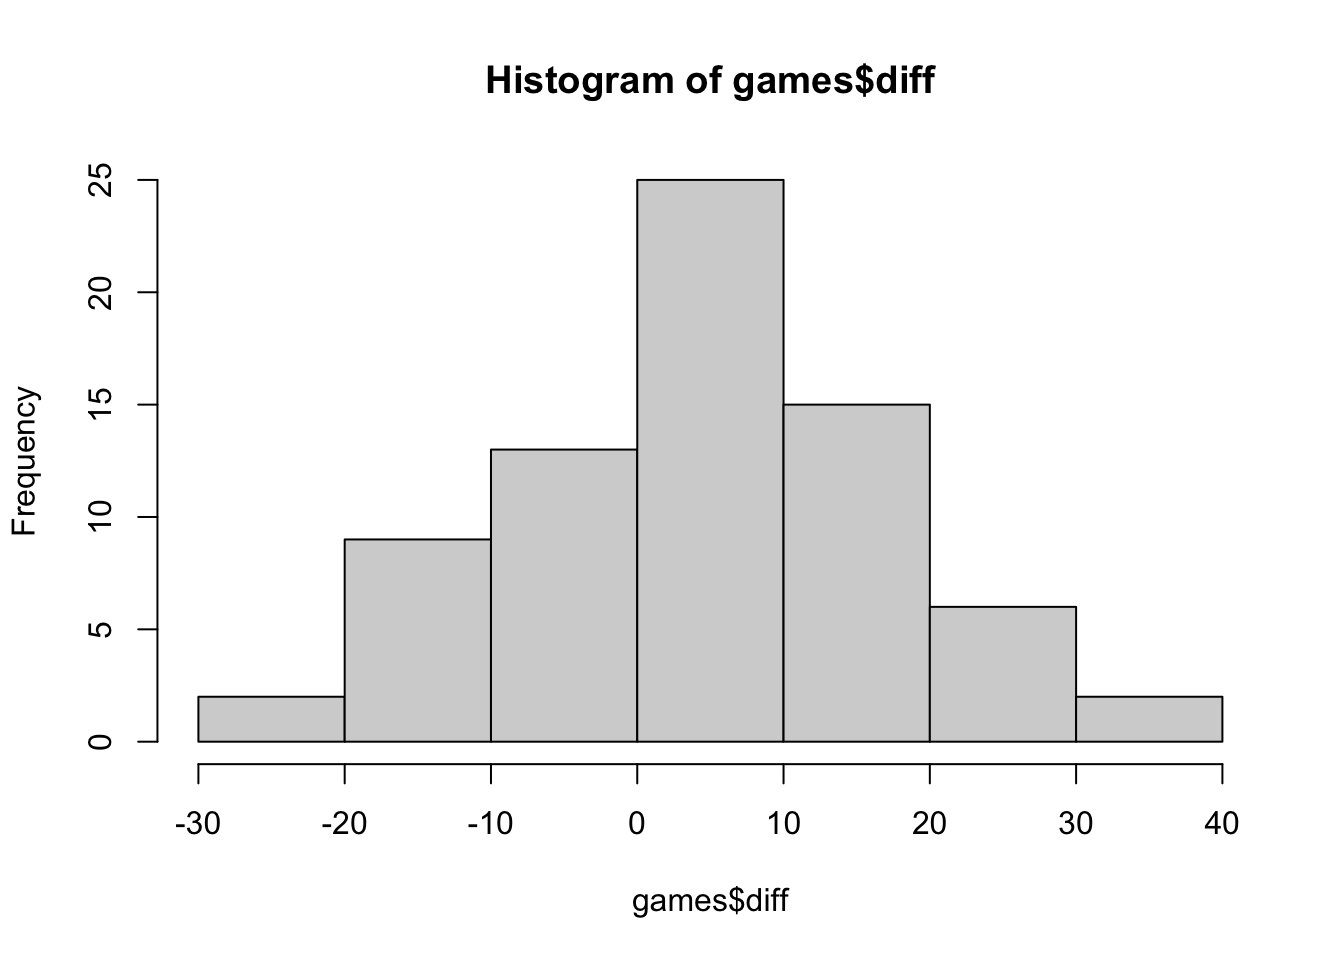
games$diff <- games$Team - games$Opp
hist(games$diff)
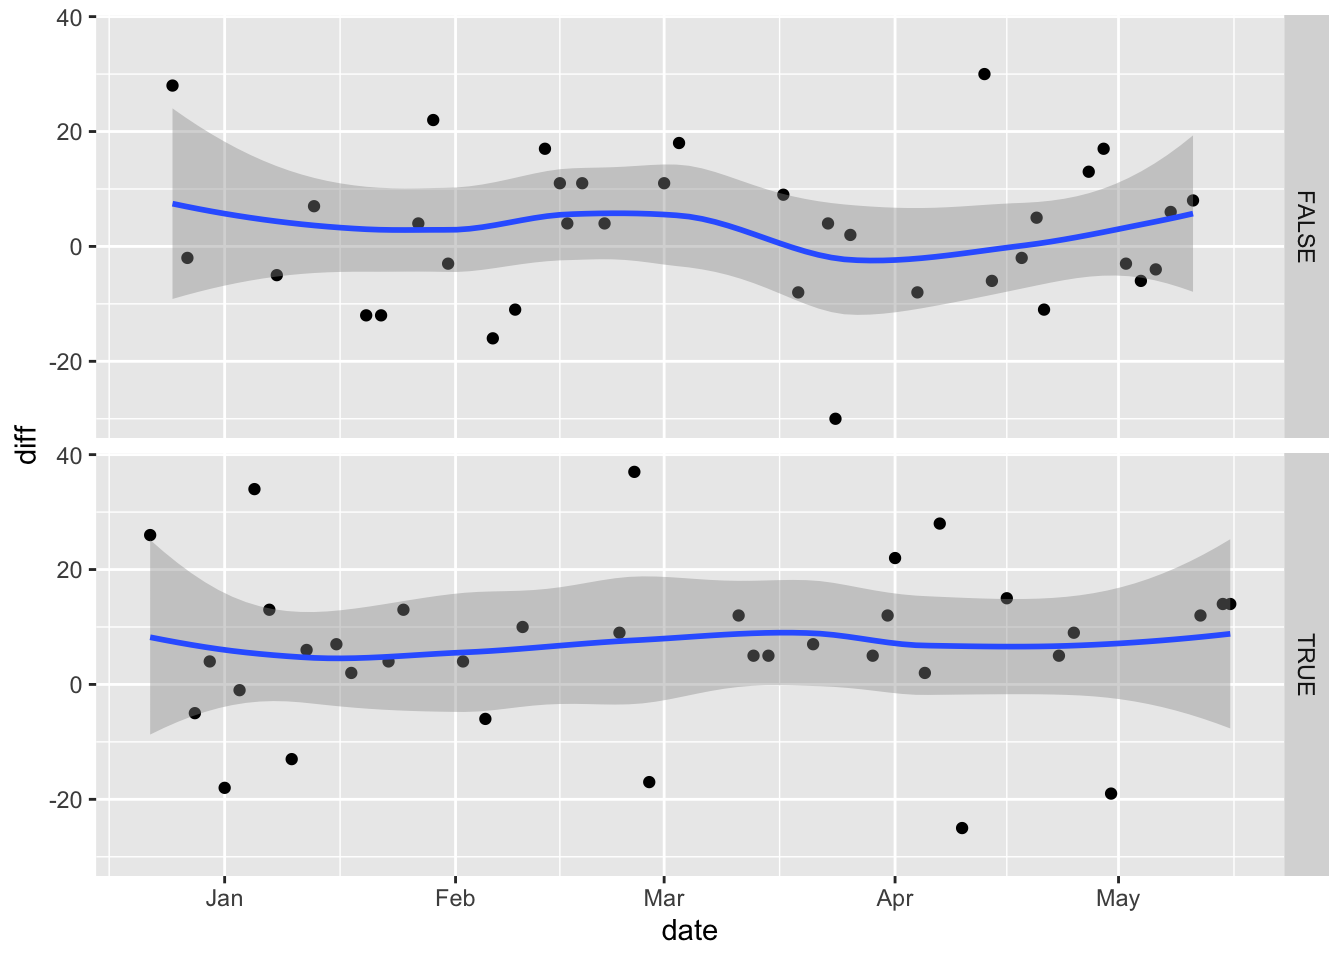
games$home <- games$Home != '@'
table(games$home)
##
## FALSE  TRUE
##    36    39
games %>% ggplot(.) + geom_point(aes(y=diff, x=date)) + facet_grid(home ~ .) + geom_smooth(aes(x=date, y=diff))
irving <- df1 %>% select(Rk, G)
names(irving) <- c("Rk", "Irving")

harden <- df2 %>% select(Rk, G)
names(harden) <- c("Rk", "Harden")

durant <- df3 %>% select(Rk, G)
names(durant) <- c("Rk", "Durant")
m <- irving %>% left_join(harden, by=c("Rk"="Rk"))
m2 <- m %>% left_join(durant, by=c("Rk"="Rk"))
data <- m2 %>% filter(Rk != "Rk")
nrow(data)
## [1] 72
data$Irving <- ifelse(is.na(data$Irving), "", data$Irving)
data$Harden <- ifelse(is.na(data$Harden), "", data$Harden)
data$Durant <- ifelse(is.na(data$Durant), "", data$Durant)
data$Irving <- data$Irving != ""
data$Harden <- data$Harden != ""
data$Durant <- data$Durant != ""
data$i <- ifelse(data$Irving, "I", "")
data$h <- ifelse(data$Harden, "H", "")
data$d <- ifelse(data$Durant, "D", "")
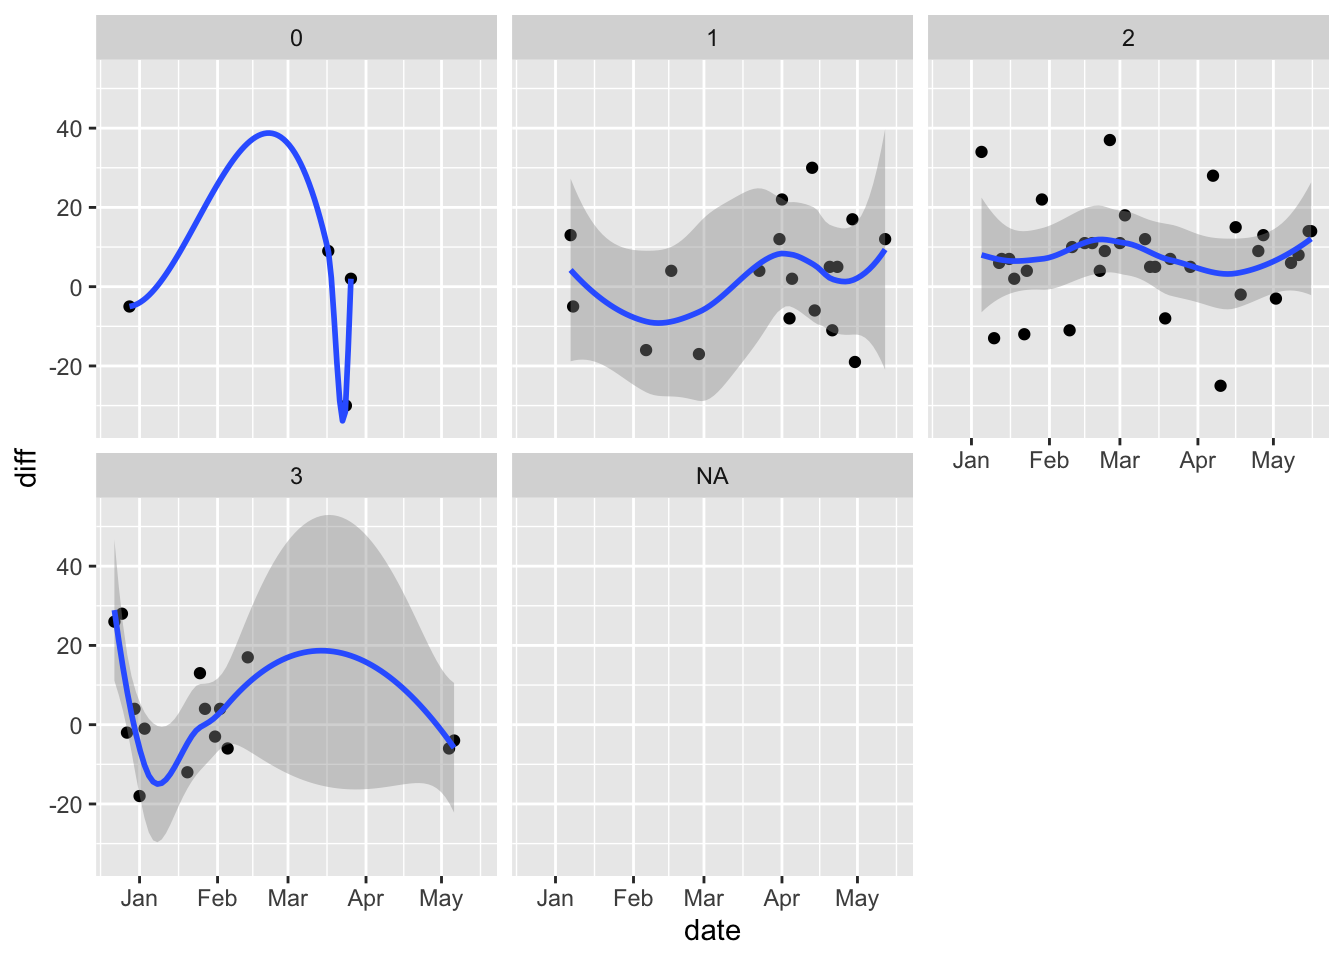
data <- data %>% mutate(N_stars = Irving + Harden + Durant)
data <- data %>% mutate(star_combo = paste(i, h, d, sep=""))
dfm <- games %>% left_join(data, by=c("G"="Rk"))
dfm %>% ggplot(.) + geom_point(aes(y=diff, x=date)) + facet_wrap(. ~ N_stars) + geom_smooth(aes(x=date, y=diff))