Results by electorate for the freedom friendly parties; sneak peak at the Victorian election
Background
We previously looked at the geographic distribution of voters who supported the Freedom Friendly Minor Parties (FFMPs) at the 2022 Australia federal election: United Australia Party (UAP), Pauline Hanson’s One Nation (PHON), and the Liberal Democratic Party (LDP). Reviewing the aggregated first preference votes by polling place showed that there was a greater concentration of support in the following places:
- South-East Queensland & regional areas in Queensland;
- along the coast and in regional towns of NSW;
- some outer suburbs of Melbourne and Sydney, 1-2 suburbs in Adelaide;
- and some regional support in Victoria.
Results by Electoral District
Although informative, reviewing the results by polling place (see previous post) is potentially deceptive as the number of votes is not easily interpretable through the size of markers representing the geographic location of the polling places. When the votes are presented by electoral district (Figure 1), the results appear slightly stronger because regional areas are disproportionately emphasised visually due to their geographic coverage, i.e. the lower population density in regional areas is not reflected within the polygons of the choropleth map. Another difference is that the clustering of voting for the FFMPs along coastal areas and towns that we saw when reviewing results at the polling place level is obscured.
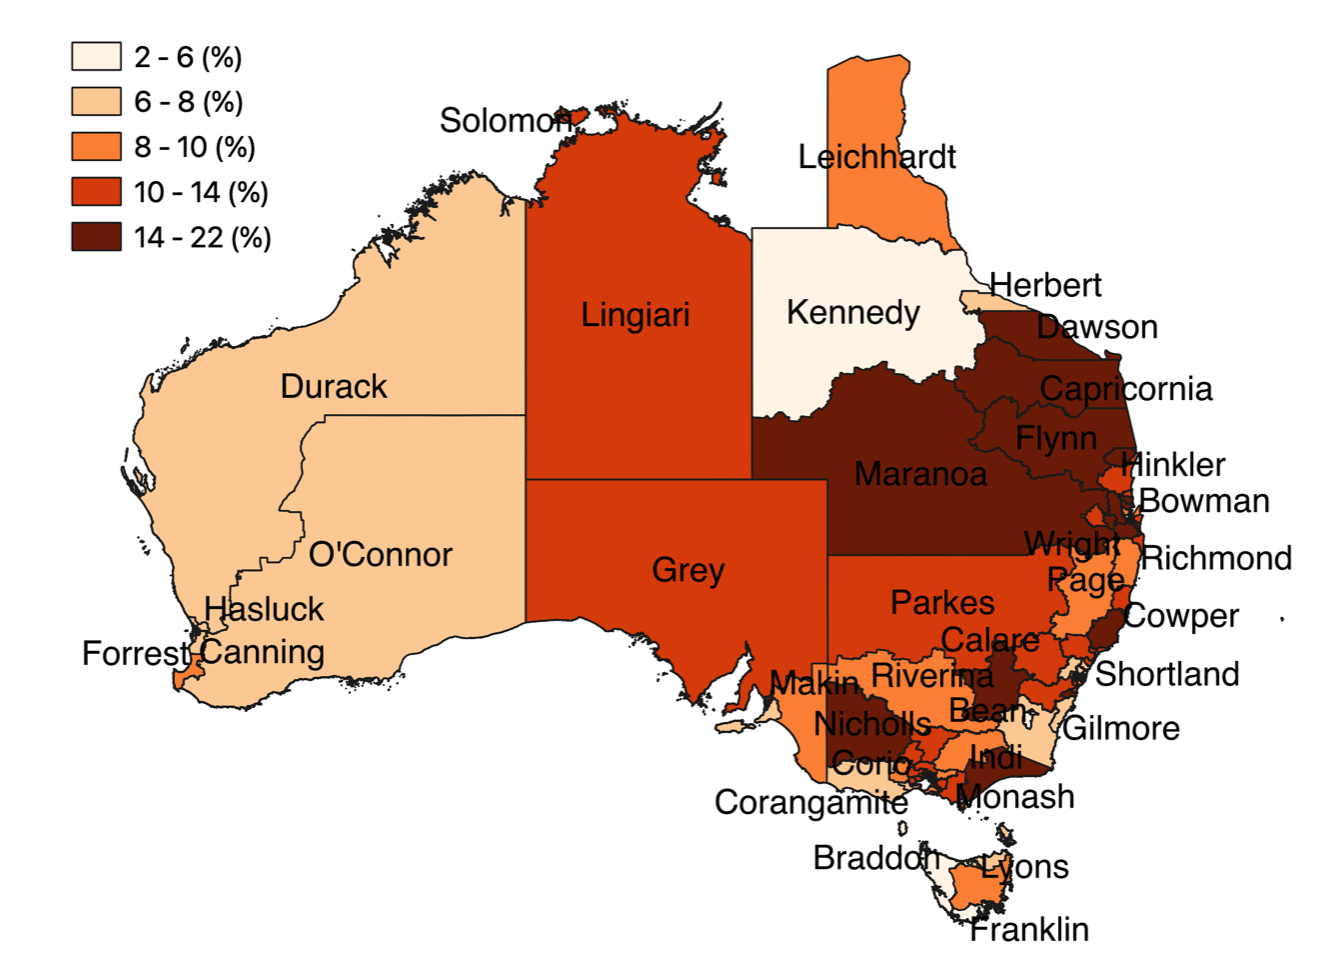
F1. Vote (%) for Freedom Friendly Minor Parties by Electorate
Moving from polling place to federal electoral district, the greater representation of FFMP voters in south-east Queensland remains, but it’s the darker shaded districts in NSW and Victoria that stand out (Figure 2). These are Gippsland (17%), Mallee (15%), Riverina (15%), Whitlam (15%), Lyne (16%).
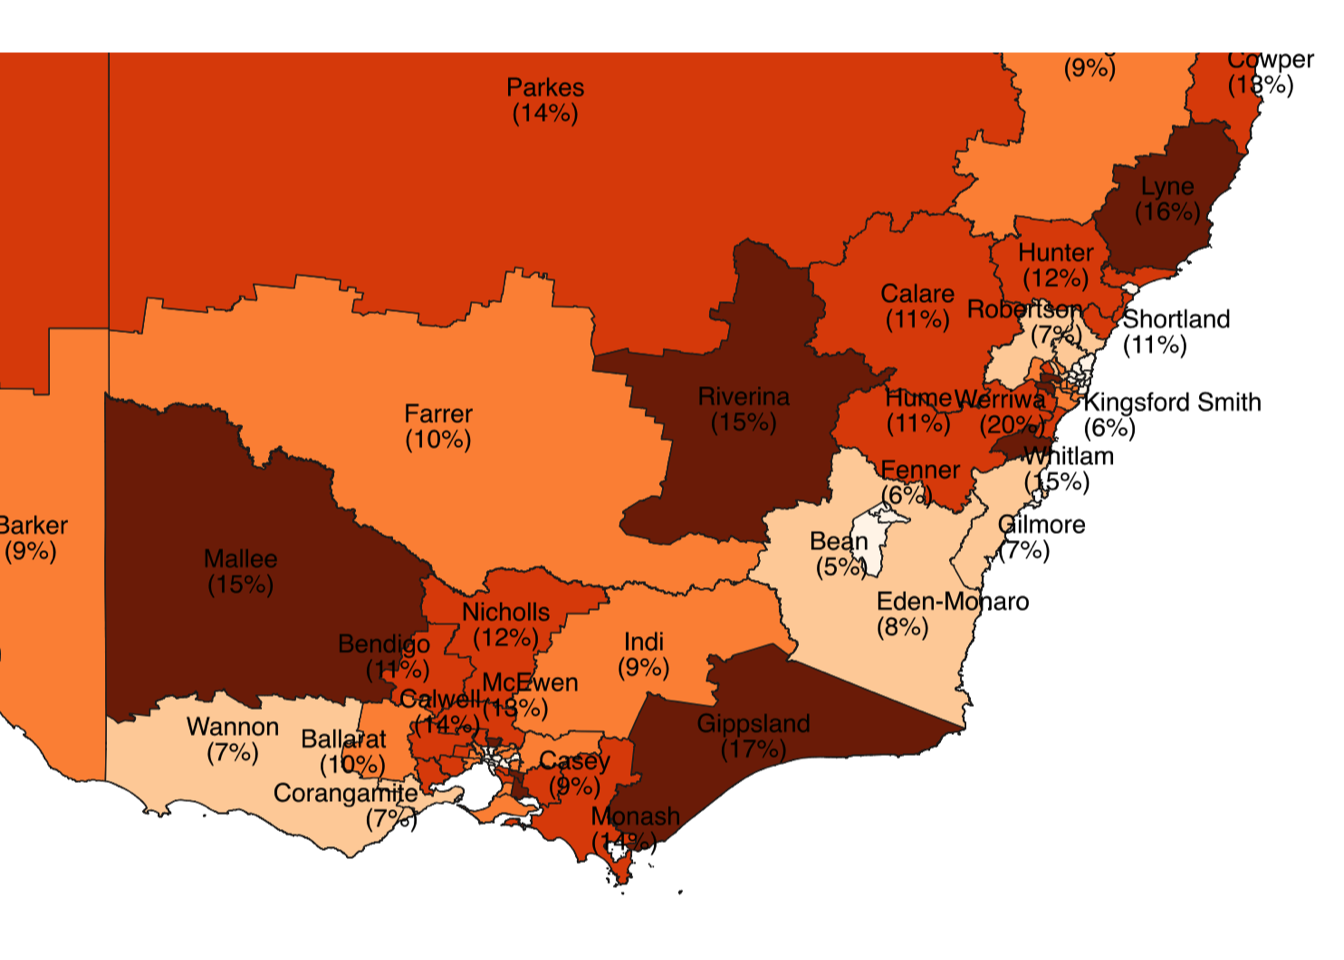
F2. Vote (%) for Freedom Friendly Minor Parties in South-East Australia by Electorate
In metropolitan areas (Table 1 below) the strongest results were in: the Western Sydney electorate of Werriwa at 20% support for the freedom parties; in Wright in the southern suburbs of Brisbane with 22% of votes, and the electorate of Solomon in Darwin at 19%. Adjacent to Werriwa, the electorate of McMahon had a respectable 16% of votes going to FFMPs.
Table 1. Top 10 electoral districts by vote (%) for Freedom Friendly Minor Parties
| id | divisionnm | state | n_poll | n_ffmp | ffmp_perc |
|---|---|---|---|---|---|
| 1 | Wright | QLD | 77325 | 17271 | 22 |
| 2 | Werriwa | NSW | 89512 | 18335 | 20 |
| 3 | Solomon | NT | 49055 | 9532 | 19 |
| 4 | Maranoa | QLD | 70292 | 13250 | 18 |
| 5 | Flynn | QLD | 73461 | 13414 | 18 |
| 6 | Capricornia | QLD | 76499 | 14371 | 18 |
| 7 | Blair | QLD | 81804 | 14776 | 18 |
| 8 | Bruce | VIC | 73062 | 12904 | 17 |
| 9 | Fadden | QLD | 83597 | 14766 | 17 |
| 10 | Gippsland | VIC | 89723 | 15274 | 17 |
Federal Election Results in Victoria
The freedom friendly parties have another opportunity to make headway in 2022 with a state election due for Victoria in November. Unfortunately, the Liberal party is coming from a long ways back, and one would expect that it would be difficult to dislodge the incumbents for several reasons. One, it is likely that recent covid related policies reflect popular sentiment in this state, despite Melbourne holding the claim to be the most locked down city in the world. Two, if the federal election provides an indication of voter preferences, state and federal differences in policymaking notwithstanding, labour managed to retain all their seats although the federal election did see a swing against both the labour and liberal parties. Last of all, with a maximum aggregate first preference vote <20% in Victoria, the FFMPs will have difficulty obtaining a majority within electorates while the duopoly major parties continue to preference each other.
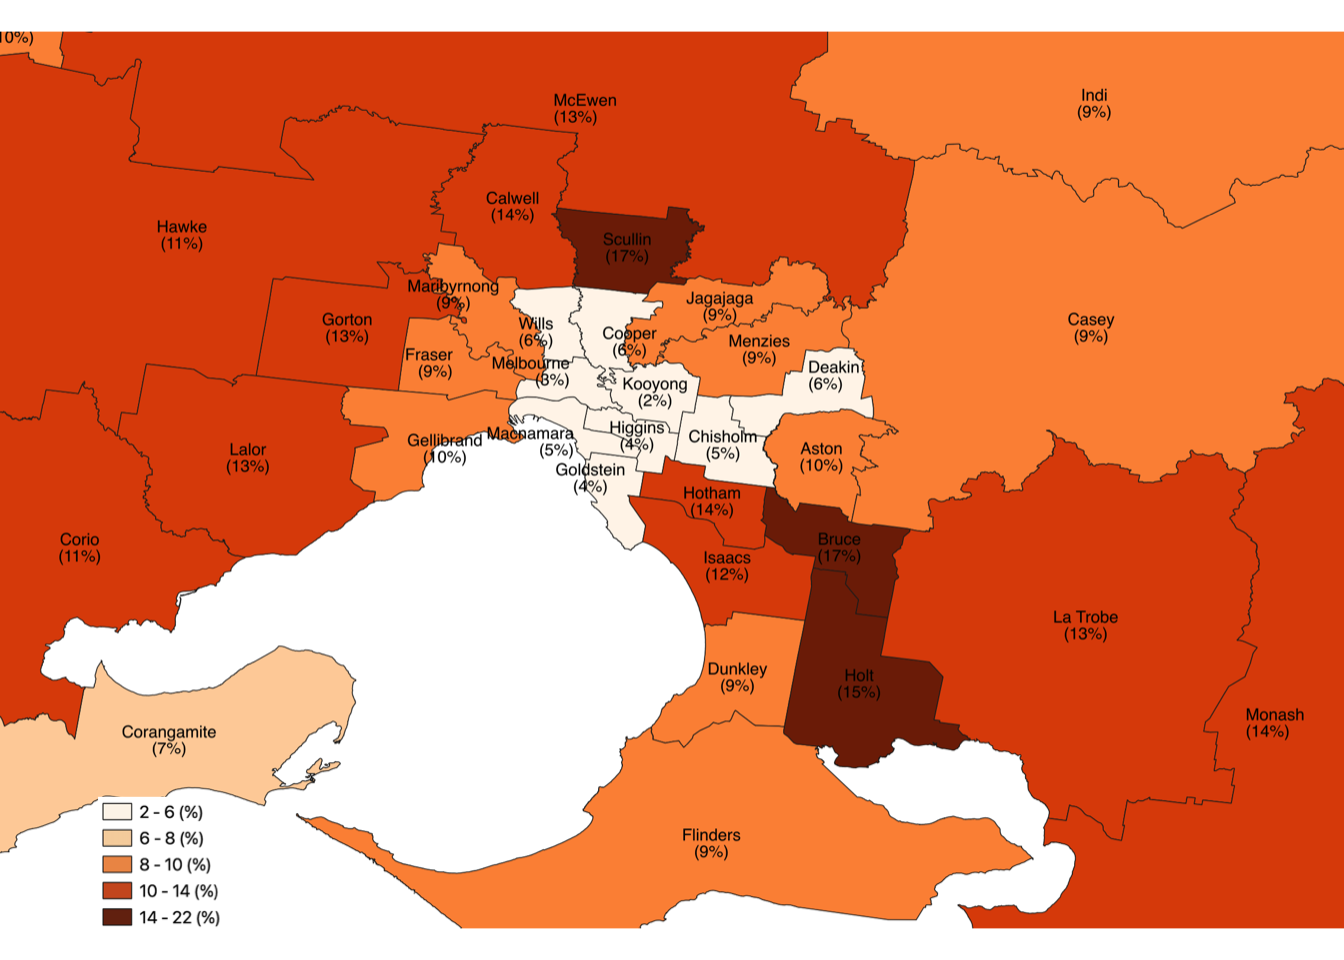
F3. Vote (%) for Freedom Friendly Minor Parties, Melbourne
Figure 3 presents the results of the federal election for the freedom friendly minor parties for Victoria. The electorates with the highest FFMP vote was 17% in Gippsland, roughly equal with Bruce and Scullin, in the south-east and northern suburbs of Melbourne respectively. As with the visualisation of the results at the polling place level, there is limited support for the FFMPs in the inner city. Table 2 below shows a list of the top 10 ranked Victorian electorates by FFMP vote.
Table 2. Top 10 electoral districts in Victoria by vote (%) for Freedom Friendly Minor Parties
| id | divisionnm | n_poll | n_ffmp | ffmp_perc |
|---|---|---|---|---|
| 1 | Gippsland | 89723 | 15274 | 17 |
| 2 | Bruce | 73062 | 12904 | 17 |
| 3 | Scullin | 73266 | 12600 | 17 |
| 4 | Mallee | 90868 | 13754 | 15 |
| 5 | Holt | 73314 | 11653 | 15 |
| 6 | Monash | 80128 | 11763 | 14 |
| 7 | Hotham | 77297 | 11479 | 14 |
| 8 | Calwell | 69967 | 10236 | 14 |
| 9 | Lalor | 72828 | 10122 | 13 |
| 10 | La Trobe | 71259 | 9406 | 13 |
Projection for the Victorian State Election, November 2022
Assuming that voter preferences translate roughly from federal to state election, by overlaying the state electoral boundaries over the first preference votes data at the polling place level, we can estimate the voter share going to the freedom friendly parties by state electorate.
From Table 3, the top 3 Victorian electoral districts by voter share going to FFMPs are: Morwell (19%), Narre Warren North (18%) and Dandenong (17%). Given that votes and geographic locations of polling places have not changed, the results for the state electoral districts largely mirror those from the federal level. The state electorates appear to be more numerous in number and have smaller geographic coverage per district.
Table 3. Projected Top 10 Victorian state electoral districts by vote (%) for Freedom Friendly Minor Parties using data from Federal election
| id | DISTRICT | n_poll | n_ffmp | ffmp_perc |
|---|---|---|---|---|
| 1 | MORWELL | 44759 | 8686 | 19 |
| 2 | NARRE WARREN NORTH | 22018 | 3980 | 18 |
| 3 | DANDENONG | 55734 | 9866 | 17 |
| 4 | MILL PARK | 17203 | 2924 | 16 |
| 5 | NARRACAN | 34078 | 5672 | 16 |
| 6 | NARRE WARREN SOUTH | 27004 | 4373 | 16 |
| 7 | MURRAY PLAINS | 36492 | 5832 | 15 |
| 8 | THOMASTOWN | 48256 | 7514 | 15 |
| 9 | CRANBOURNE | 44215 | 6882 | 15 |
| 10 | MILDURA | 35461 | 5397 | 15 |
The strongest results in Melbourne (Figure 4) are: a south-eastern cluster of the adjacent suburbs of Narre Warren North (17%), Narre Warren South (16%), Dandenong (17%), and Cranbourne (15%), as well as a northern cluster of Greenvale (15%), Thomastown (15%) and Mill Park (16%). A contiguous agglomeration of 2nd quantile electorates, stretching from the west to northern suburbs of Melbourne (Werribee, Tarneit, Kororoit, Sydenham, St Albans, Niddrie, Sunbury, Broadmeadows, Kalkallo & Yan Yean), separates the top quantile electorate of Lara (15%) from the northern cluster.
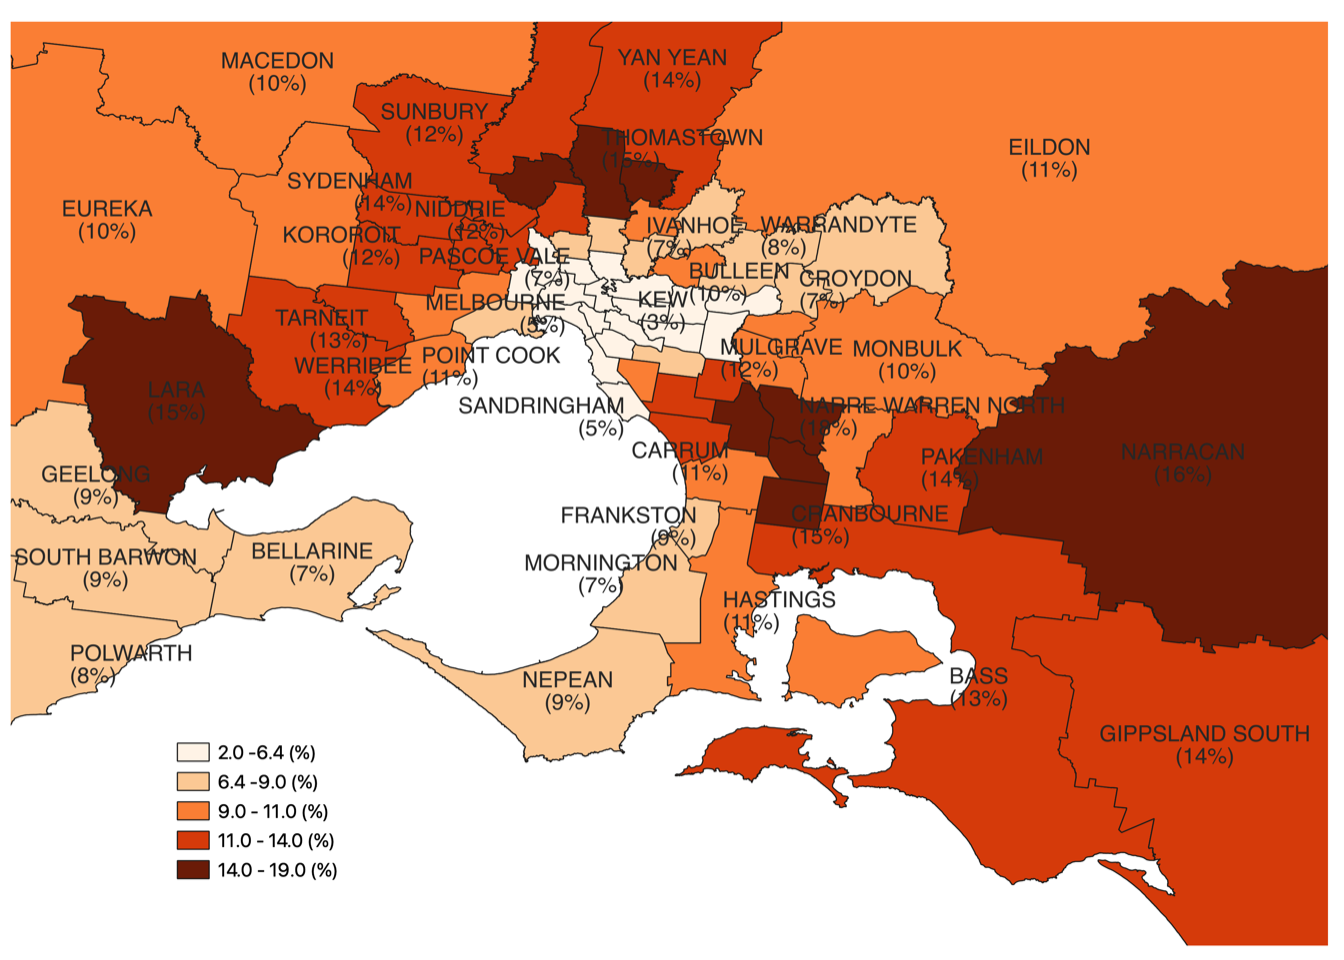
F4. Projected Vote (%) for Freedom Friendly Minor Parties, Inner/Outer Melbourne
Concluding Remarks
In addition to having different public policy areas of relevance - states have responsibility for health, education and roads, whereas the federal government has responsibility for issues like income tax, immigration - the exclusion of votes from polling places without geographic coordinates, which can largely attributed to those polling places having multiple sites, will also bias the projected state election results.
The 3-term incumbents (2013 Abott, 2016 Turnbull, and 2019 Morrison) were decisively removed at the Federal election in May. It remains to be seen whether Victorians will do the same to a 2-term Andrews (2014 & 2018) government at the state level. A change in government seems less likely for the reasons mentioned earlier, and also because there is perceived weakness in the state opposition with Matthew Guy getting a second run at the election; the liberal/national coalition received 35.2% votes in the 2018 election with a 6.8% swing against it, albeit under vastly different circumstances.
Will Victorian citizens hold the Andrews government to account for the current state of the health system? What is the extent of the support for the continuing expansion of the state in Victoria 2022?
Additional Figures
For reference, Figure 5 presents a histogram of the projected FFMP results at the electorate level for the Victorian election, while Figure 6 presents the same information as a choropleth map with the electoral boundaries.

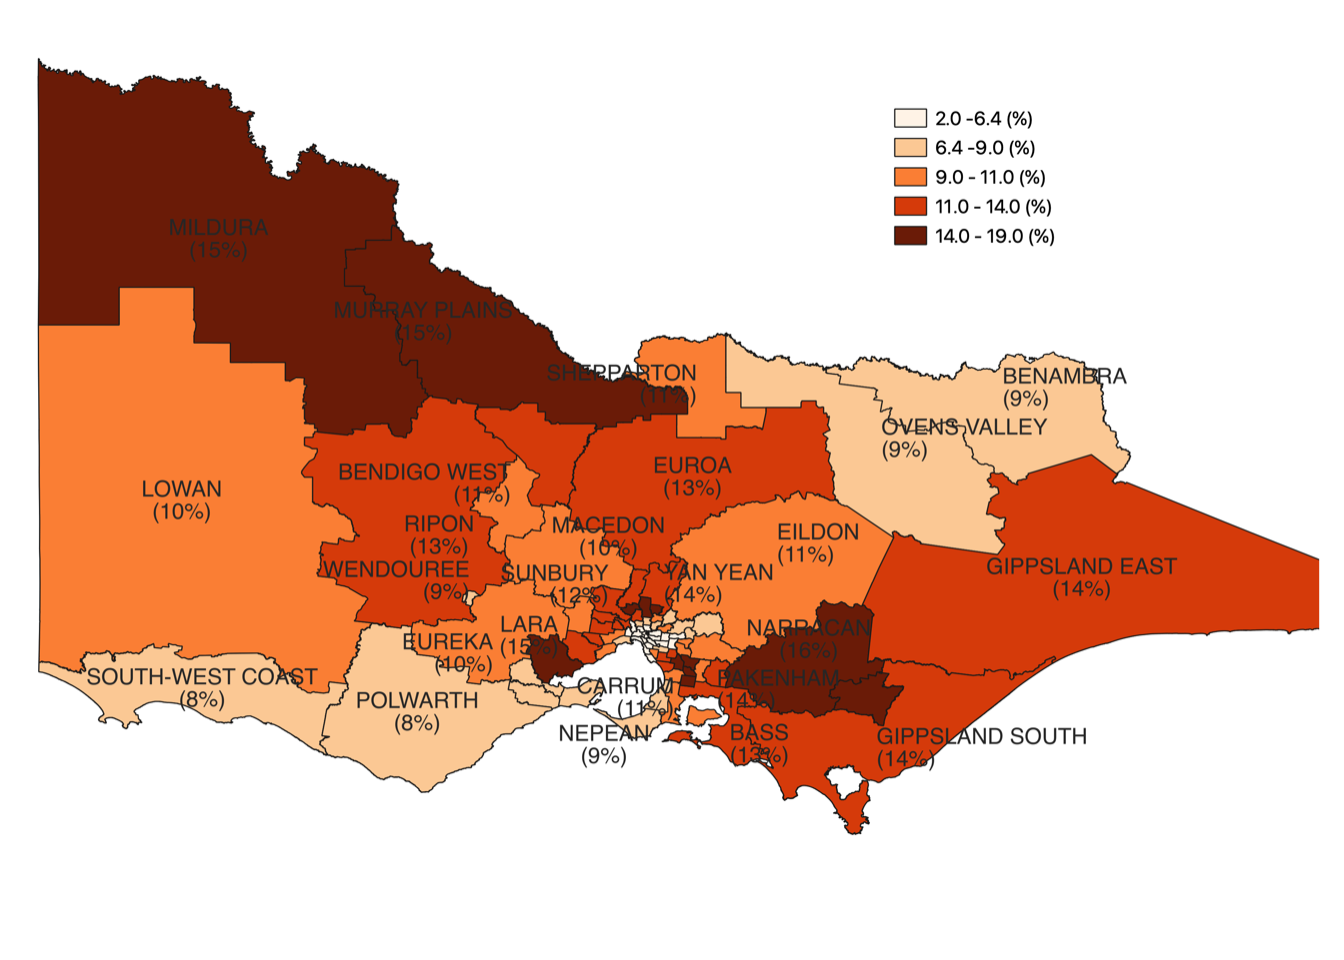
F6. Projected Vote (%) for Freedom Friendly Minor Parties, Victoria